New Vocabulary, Intense Rainfall, Renewables, and Then Norway
Pyrocumulonimbus clouds.
Now that is the word of the day. Pronounce it please, and get familiar with it, as we will be seeing this in print more frequently in the future. Those vocabulary wonks among us might enjoy its technical name, cumulonimbus flammagenitus [CbFg]. According to Dr. Flannigan at University of British Columbia, “They are by far the most intense fires in the world.” See Wikipedia for additional information.
It is a relatively new cloud classification and the pyro portion obviously has to do with fire. What firefighters and scientists are finding is that some of the intense fires in the western U.S. and Canada are now creating their own weather.
Severe drought and high temperatures exacerbated by climate change are creating tinderbox conditions in some forest areas. These fires burn so hot, so fast, that the rising heated air pulls in more oxygen at ground level creating a firestorm. The heated air with smoke, soot and fine ash rises into the stratosphere to heights of more than 50,000 feet.
See illustration/ image from Wikipedia where 1. Is the fire, 2. Is the updraft, 3. strong gusty winds that feed the flames, and “A” is the cloud itself.
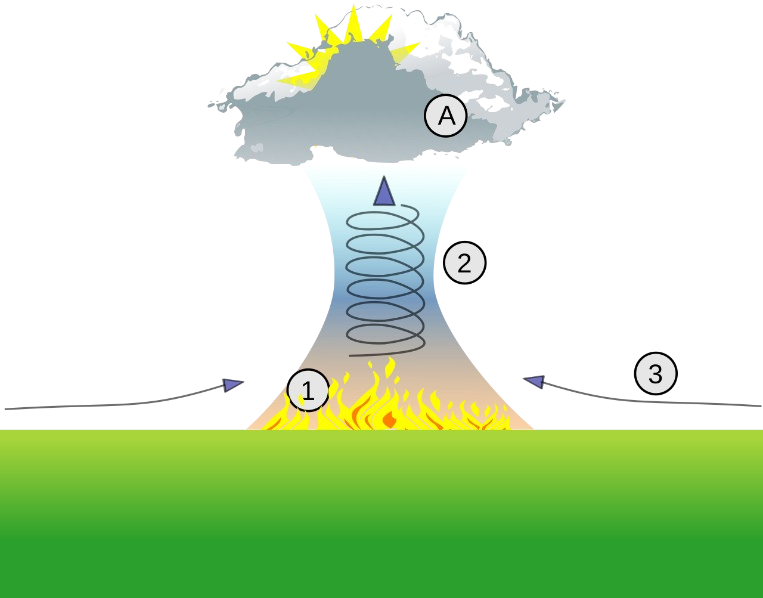
The Carr fire in 2018 in California created a fire vortex with winds as high as 140 mph and temperatures greater than 2,000 degrees F.
Let us look at another interesting weather phenomenon from just this past week.
See the radar image with map of Hurricane Debby supplied by “radar.weather.gov.” It shows the storms eye crossing over northern Florida. But it is the rain forecast that is astonishing. The forecast is that parts of Georgia and South Carolina couldreceive from 20 to 30 inches of rain. The warmer than usual waters of the Gulf and the Atlantic Ocean are supplying the moisture to power this event.
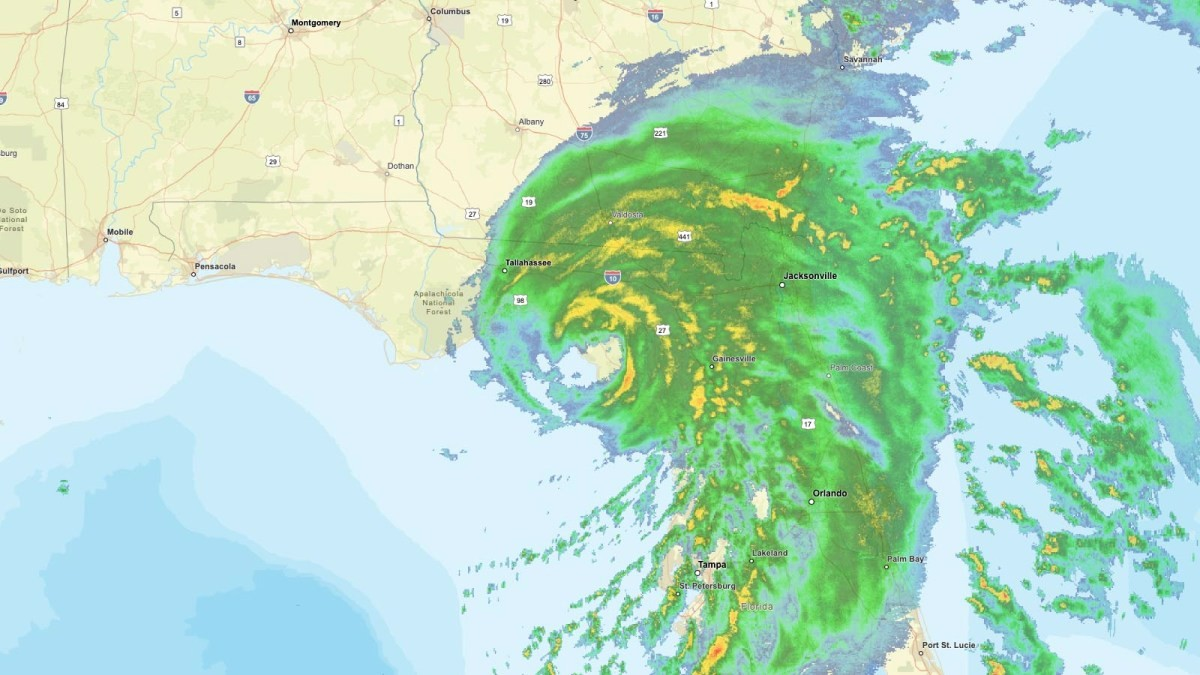
Radar image of Debby at landfall in Florida, 7.a.m. EDT August 5, 2024. (Image credit: radar.weather.gov)
Now let us consider the details of this for a moment. One acre is about 209’ X 209’ [feet] in size or a total of about 43,560 square feet. Now consider covering this acre with one inch of water. This would equal about 27,000 gallons of water per acre. Now please stay with me here. So, 20 inches of rain would deliver about 540,000 gallons, or more than one half million gallons on this 209 x 209 square feet of land. And, if the amount is 30 inches, well you can do the math.
And this is just the amount per acre. The amount of water that falls over a larger region of many square miles [640 acres per square mile] is just enormous.
Continuing with this theme, consider the region, the land, cityscape, infrastructure, homes, buildings and so on that must deal with this sudden influx of catastrophic rainfall amounts over a large area in a short period of time. These extreme weather events are becoming the norm and are costing all of us enormous amounts of money annually.
And, according to the goals set by the global community in Paris [Intergovernmental Panel on Climate Change] in 2016, collectively we must limit the temperature increase to no more than 2 degrees Centigrade with a goal of less than 1.5 degrees C. This requires all nations to reduce their carbon emissions 40% by 2030 and 60% by 2035 compared to 2019.
Collectively, we are not doing a good job. Emissions are still increasing, and we have a lot of work to do.
However, some nations and regions are stepping up to the plate.
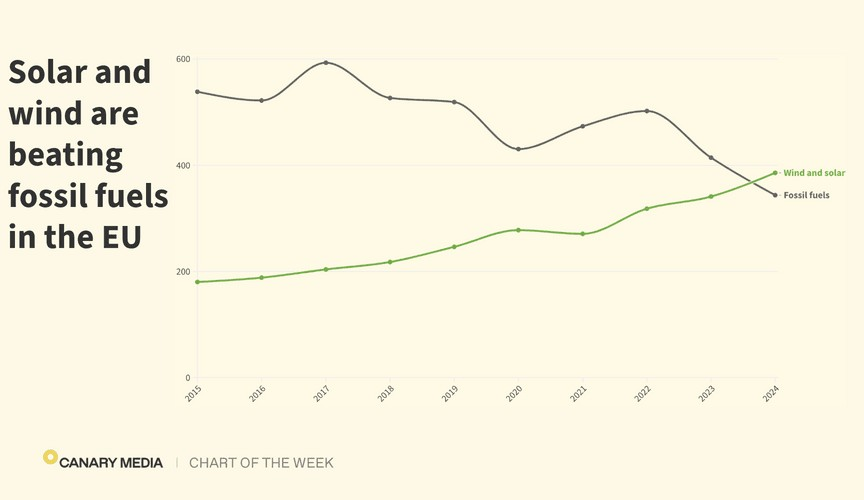
See the two curves in the graph with the title, “Solar and wind are beating fossil fuels in the EU.” This is a significant accomplishment and refers to the energy put into the power grid. Thanks to Canary Media for the graph.
And, the EU [European Union] is not the only success story. Then we have the 6th largest economy in the world, California. In a report from April 2024, the combination of wind, solar and hydro exceeded 100% of demand on California’s main grid for 30 of the past 38 days.
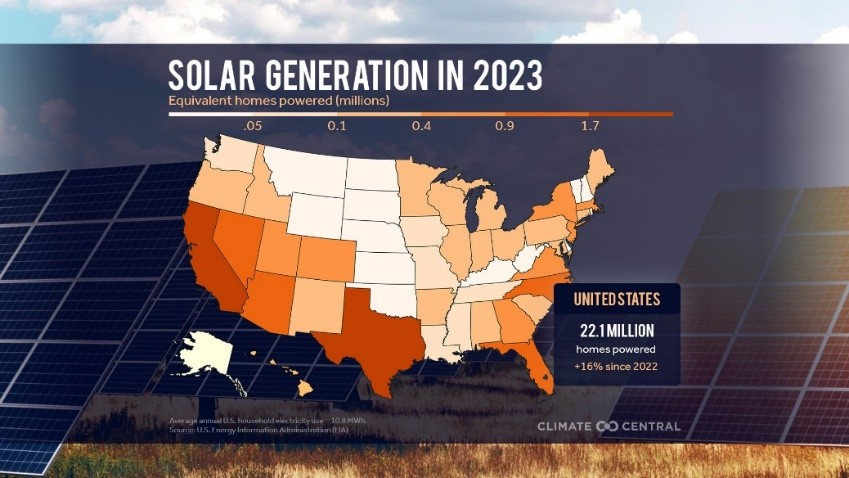
The map of the U.S. provided by Climate Central titled, “Solar Generation in 2023” indicates that about 22.1 million homes [equivalent] were powered by solar that year, which was a 16% gain from 2022.
Let us look at another map of the U.S. titled “Wind Generation in 2023” also provided by Climate Central. The data here states that 39.4 million homes were powered by wind.
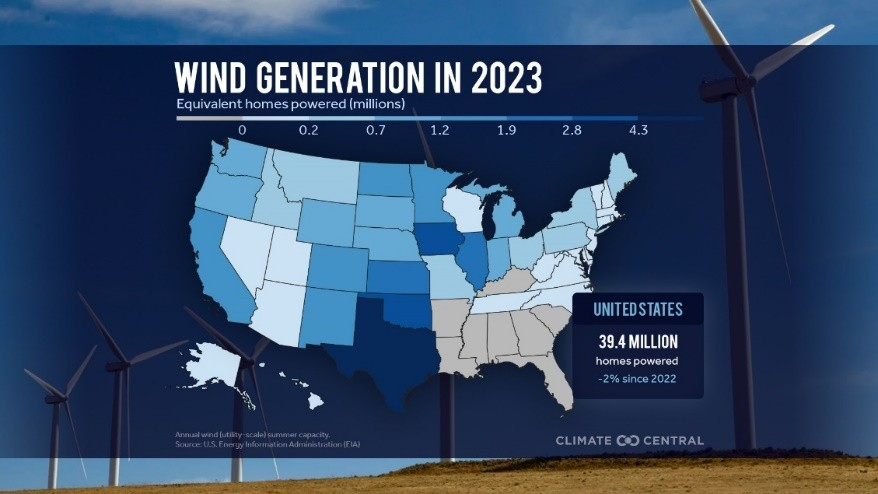
These efforts are encouraging and significant; and are continuing. It is interesting to note that Texas is leading the rest of the states for both solar and wind.
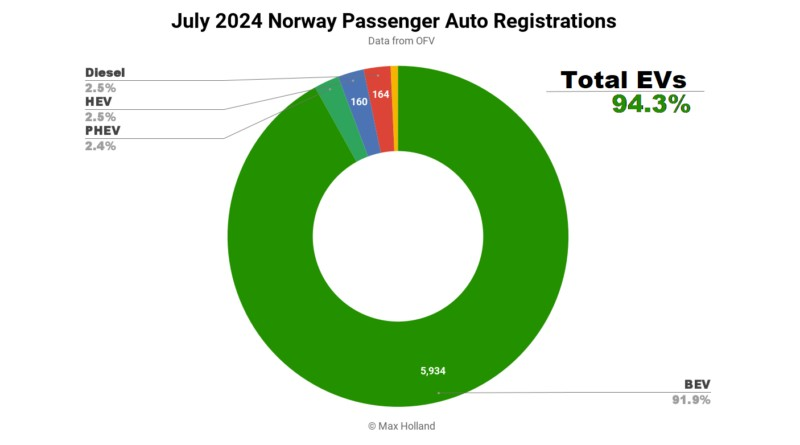
And then we have Norway with a population of ~ 5.5 million people and in July 2024, 91.9% of the new cars registered were full battery electric vehicles with a few hybrids and diesels thrown into the mix.
And so it goes.
The scientific career of Raymond N. Johnson, Ph.D., spanned 30 years in research and development as an organic/analytical chemist. He is currently founder and director of the Institute of Climate Studies USA (www.ICSUSA.org). Climate Science is published monthly.


