Warmer Ocean Waters, Climate Tidbits, Renewables and More
Disdrometers. This is probably a new word for most of us, except for perhaps, meteorologists.
A disdrometer is a relatively new instrument that measures hailstones up to about 3 inches in size, and provides information on the number, and size distribution, and thus gets a measure of the energy of a falling hailstone event. The fact is that hailstones caused losses in the U.S. about $46 billion in 2023. This includes crops, vehicles, as well as home [ primarily roof] damage.
And, a warming planet and climate change, appears to be increasing hail losses of all kinds.
Enter, the hail chasers!
The photo image here from The Weather Network of a hand holding 2 large hailstones the size of a tennis ball illustrates the need to better understand their formation, size range, and intensity. With improved forecasts people can shelter indoors and park their cars in garages, for example. An on-line search shows dramatic shots of smashed windshields, severely dented hoods, damaged homes and more because of these hailstorms.
Hail is normally formed by raindrops being sent high into the atmosphere by a strong updraft, where they freeze, fall, and get uplifted any number of times until they get so heavy they fall to the ground.
According to an article in Science [6 September 2024], a hailstone study is planned to use disdrometers and other instruments in spring 2025, with over 100 scientists in 11 states participating. This should improve understanding of these events and aid in forecasting these energetic threats.
A tidbit: the energy of a common 2-inch hailstone has three times the energy of a penny dropped off the Empire State Building.

Hurricanes have sure captured the headlines of late, and with good reason. Hurricane Helene powered through several states in the southeast recently and caused an enormous loss of life, damage to infrastructure, property, and, long-term injury to the psyche of the survivors. The pictures in the media are heartbreaking and just hard to believe.
Preliminary estimates are that damages from Helene will exceed $175 billion. Climate change and our warming climate are beginning to cost us, all of us, and it is not clear where all this money will come from.
Let’s take a look at an earlier hurricane, Beryl, in late June/July 2024. The image from Climate Central titled, Hurricane Beryl, clearly shows the impact of ocean water heat [temperature] on the quickening of the hurricane’s energy and Category Rating.
When we look at the dark dots representing the days of this storm as it moves west [right to left in this map] across the Atlantic Ocean towards South America [SA] we can see where it enters the warmer waters off the northeast coast of SA. The waters here were 2-3 degrees F warmer than normal and the darker areas in the illustration represent increasing water temperatures.
As the storm moved into these darker [warmer] waters it rapidly undergoes a remarkably fast strengthening from Category 1 to Category 2, then 3, then 4, [see inset image] and finally 5 as it continues to pick up energy from the warmer than usual ocean waters off Venezuela.
Beryl begins to weaken as it enters some cooler waters [at that time] in the western Gulf of Mexico before heading inland as a weaker Category 1 hurricane.
Meteorologists are considering an additional classification of Category 6 to account for super powerful storms.
As Dr. Daniel Gilford, climate scientist, Climate Central, said, “Beryl is a striking illustration that this year’s hurricanes are growing in an environment clearly warmed by human-caused climate change.”
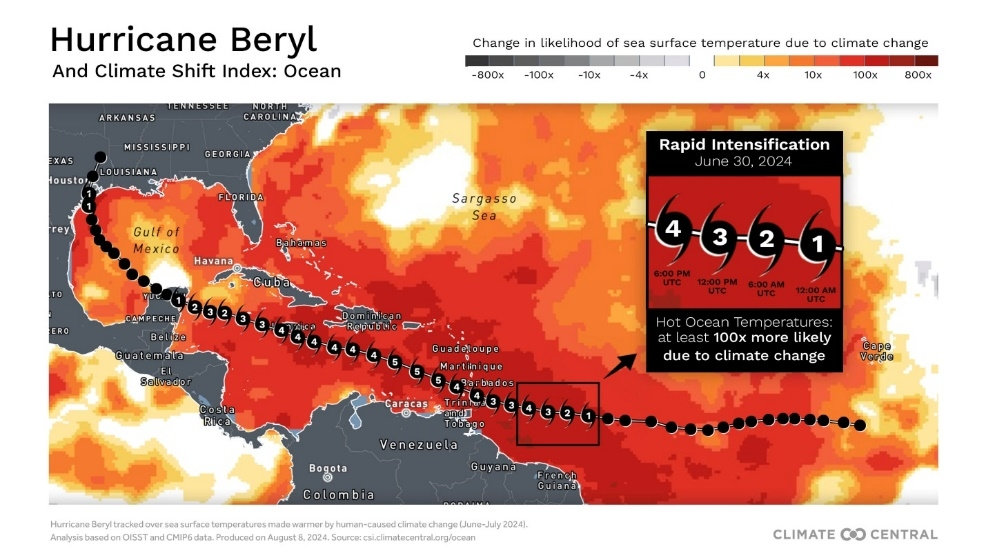
This composite image [Hurricane Beryl] provided by Climate Central contains sea surface temperature data from June and July and was prepared on August 8, 2024.
And now we have Hurricane Milton. A monster of a storm developing in early October that went from Category 1 to Category 5 in less than 24 hours with sustained winds of 190+ mph. Wind shear and other atmospheric conditions have reduced its intensity somewhat, but it is still an enormous and powerful storm. Landfall is expected in central Florida by October 10. It will not be good for the residents and their property.
However, …
Lots of other actions, installations and events are happening this year in many places in an attempt to get a handle on our “emission” problem. One of them is “awareness.”
The respected magazine/journal, “The Economist” recently had an issue dedicated to the “Dawn Of The Solar Age.”
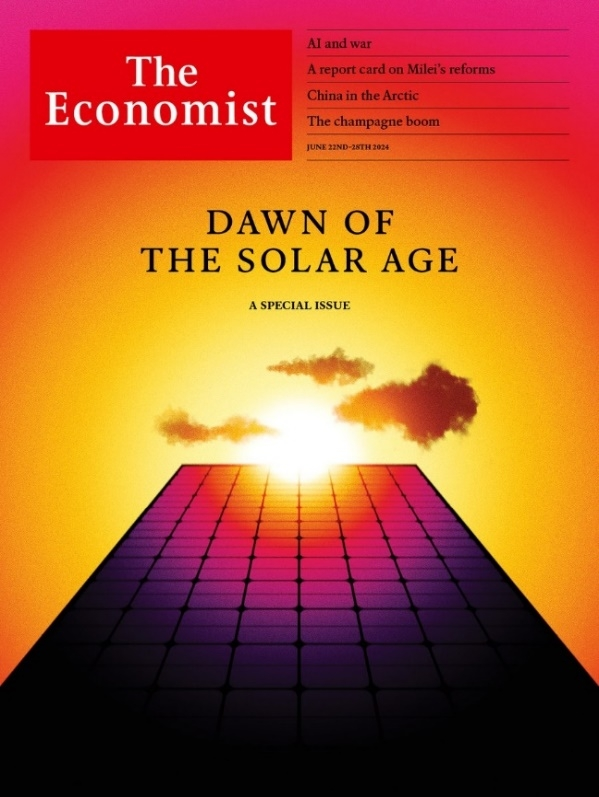
It is becoming more widely recognized that the sun as a source of energy for most of our energy needs is a big part of the solution for reducing carbon emissions and the impact on our global climate. The influence of this journal and its touting of solar energy, on policy makers, is significant.
As we all need to reduce our carbon emissions, progress is being made in several areas to reduce emissions from transportation and energy generation.
Here are just a few other activities of note.
Norway, for example, for the first time has more electric cars on the road than petrol models. This was published in the journal Arctic: Business Journal, in September 2024.
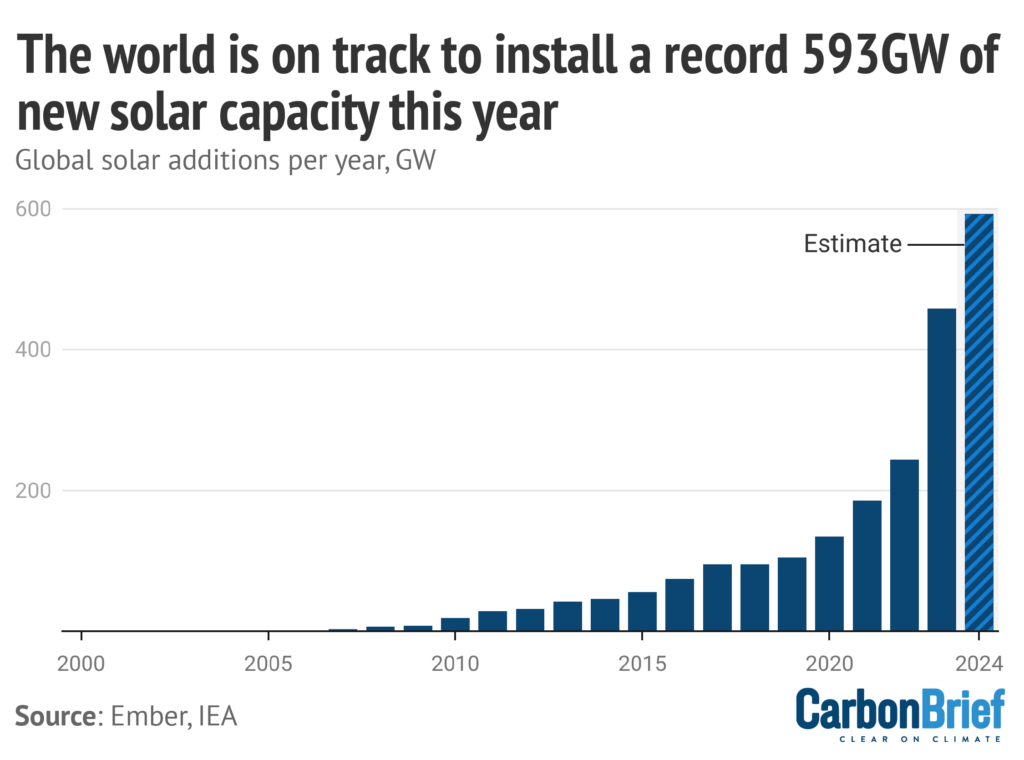
In 2023 the world shattered global records with 428 gigawatts of solar power installed according to Canary Media in August 2024.
And now in 2024, the world is on track to install a record 593 gigawatts of new solar capacity. See the vertical bar chart titled, “The world is on track to install a record 593 GW of new solar capacity this year” from CarbonBrief, with data from Ember, IEA.
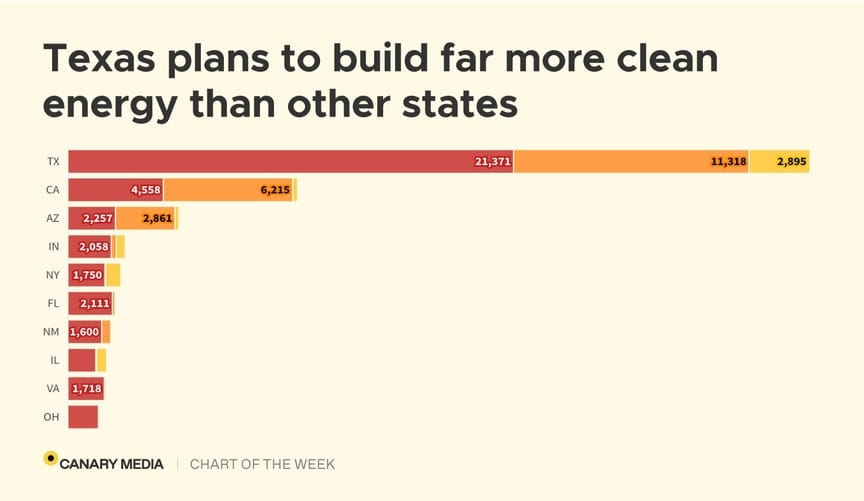
And then, of course, we have home-grown progress in the form of renewable energy installations. See the horizontal bar chart labeled, “Texas plans to build far more clean energy than other states.” The units in each bar are in megawatts [mw] with the plans extending to December 2025. Texas clearly leads California which is in second place here.
The bars have 3 colors or shades in it with the dark portion for Texas, “Solar [21,371mw],” the next lighter portion “Batteries [11,318 mw],” and finally the lightest color on the right is “Wind [2,895 mw].”
And so it goes ....
The scientific career of Raymond N. Johnson, Ph.D., spanned 30 years in research and development as an organic/analytical chemist. He is currently founder and director of the Institute of Climate Studies USA (www.ICSUSA.org). Climate Science is published monthly.


