
Weather, Climate and Atmospheric Rivers
Our weather and climate have been terribly busy of late. Let’s remember that weather is what we see outside our window today, while climate is the longer-term change in our weather, typically on the order of 1 -2 decades.
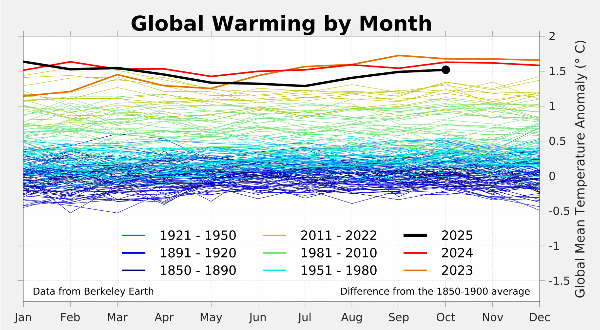
Berkeley Earth is a climate research organization based in California that uses data from many sources to assess changes in Earth’s climate. The graph below, “Global Warming by Month,” earlier versions of which have been shown here before, is the most current one available. It gives the current global air temperature data through October and presents it as an “Anomaly” from long term temperature measurements [note right axis].
The data show that October 2025[black dot]is the third warmest in the temperature record, going back more than 150 years. All of this heat, this extra energy in the atmosphere as a result of increasing amounts of greenhouse gases [GHG], has consequences.
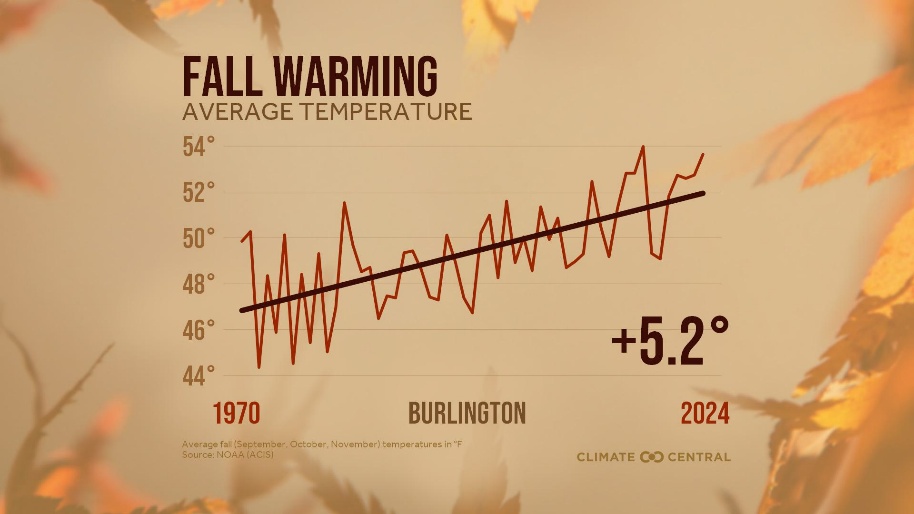
One consequence is reflected in the graph labeled, “Fall Warming” from Climate Central, of more than 50 years of Fall temperatures in the city of Burlington, VT. During this 50-year time interval the average temperature has increased by 5. 2°F on average.
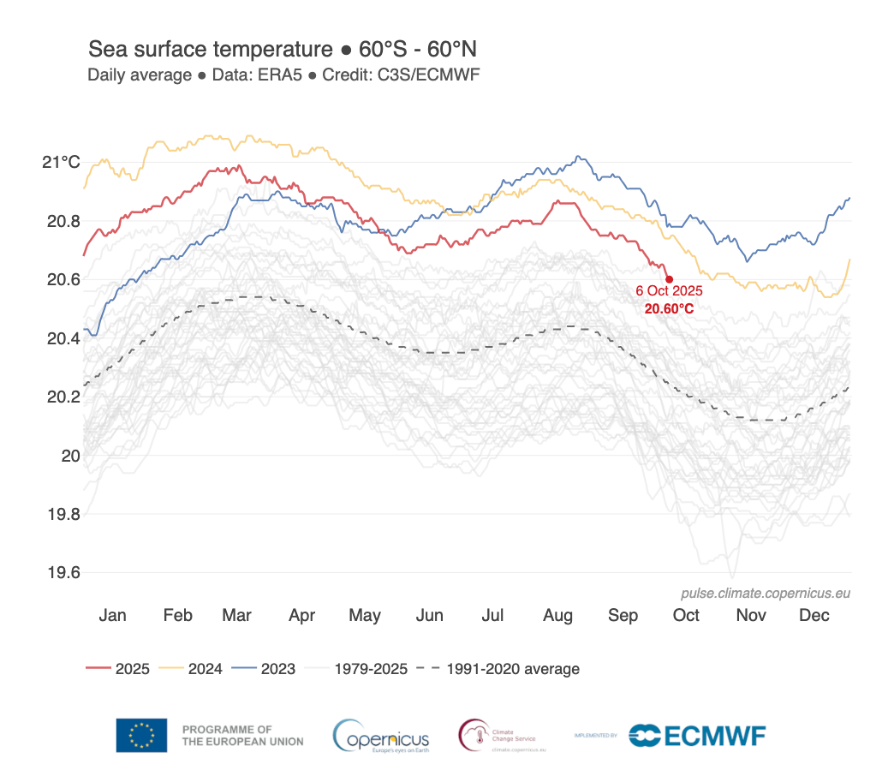
In addition to increased air temperatures, Earth’s oceans are also warming. See the 12-month graph labeled “Sea surface temperature; 60° S – 60° N. ”This graph covers 12 months of ocean water temperatures in all but the polar regions at both ends of the planet.
Note that here again the sea surface temperatures, in centigrade, are the third warmest in the record. Data is from the European Center for Medium-Range Weather Forecasts [ECMWF], and other research organizations, through 6 Oct 2025.
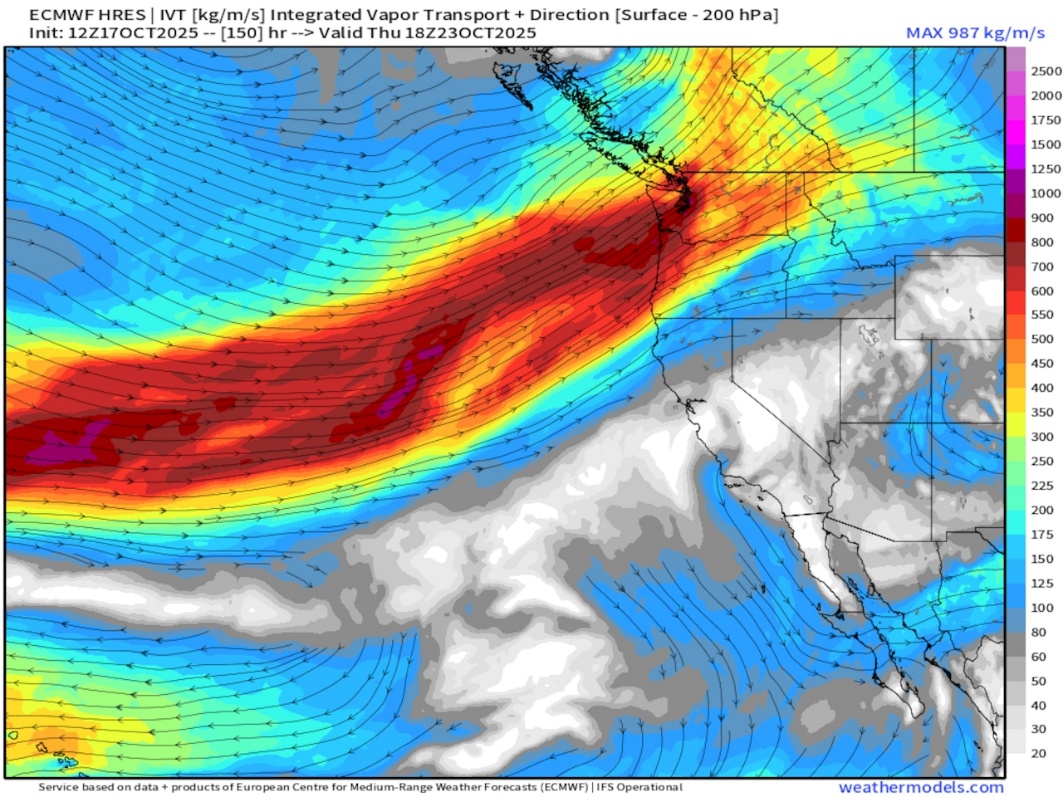
One major event that can be enhanced when sea surface temperatures are high is called an atmospheric river [AR]. The image here from ECMWF illustrates this pattern. The image shows in outline the western states of the U. S., with a very dark band of extensive moisture moving from center left up to the right heading into the Pacific Northwest.
This image is of an event that happened from October 18 – October 23, 2025.
According to Wikipedia, “Atmospheric rivers consist of narrow bands of enhanced water vapor transport” …. They can be about 100 – 150 miles wide and over 1, 500 – 2, 000 miles long, “and asingle one can carry agreater flux of water than Earth’slargest river, the Amazon River. … These have been increasing in intensity ” more recently delivering enormous amounts of rain over aperiod of several days. The flooding can be extreme.
According to Science Advances Vol. 5, No. 12, 4 Dec 2019, “There is a growing awareness that ARs are responsible for a wide range of environmental, social, and economic impacts ….” This is playing out in the Northwest now, 8 December, 2025.
On December 10, 2025 the Washington State Emergency Operations Center has elevated its risk assessment to Level 1, the highest level possible. In addition, the National Weather Service [NWS] stated that catastrophic flooding could occur on both the Skagit and Snohomish Rivers.
Kirby Cook, ameteorologist with the NWS in Seattle, explained that from 8 – 15 inches of rain could be expected in the central Cascades. 29 Western WA rivers have been issued aflood warning while” more than ten rivers reached Flood Level 4, the highest warning phase. ”[mynorthwest. com].
And these enhanced weather patterns are beginning to cost us, all of us, with increased insurance costs. See the map of the western U. S. with the outlines of ten western states. It is titled “Proportion of insured losses due to ARs. ”
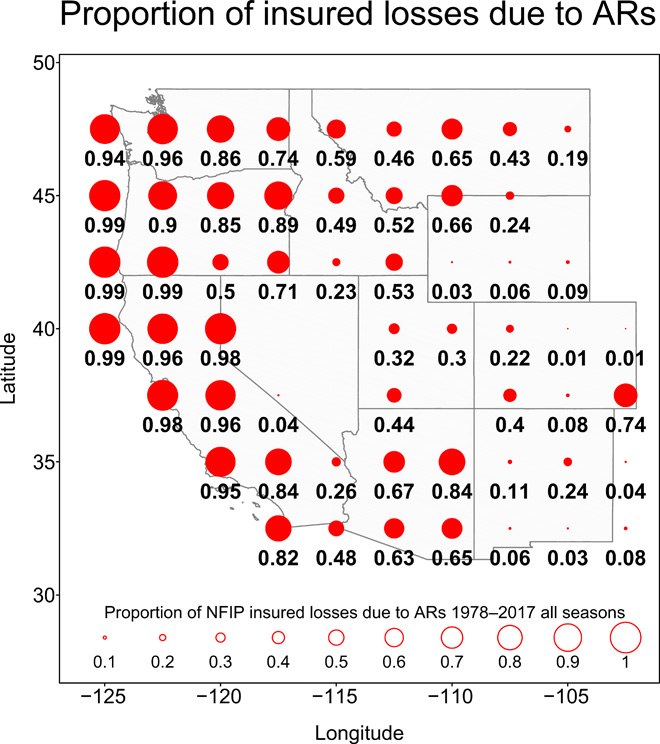
The red dots all have a decimal, or number. For example, the upper left large dot has 0. 94 just below it. This suggests that 94% of insured losses in that area are due to flood damages from all varieties of storms with ARs being by far the primary weather event.
Then we have some miscellaneous items.
- World population was 8. 09 billion on January 1, 202 5 ; an increase of 71 million in 2024.[The New York Times, 12/31/24].
- World Court rules[November 12, 2025]that the U. S. is legally obligated to curb climate change.[Earth Justice].
- Head of IRENA [International Renewable Energy Agency], Francesco La Camera, stated at a conference in Singapore “ … the unprecedented dominance of renewable sin new energy projects … is accelerating, not faltering.” [CleanTechnica 11/3/ 25].
- China built a 162 square mile solar farm on the Tibetan Plateau at 10, 000 feet where the sunlight is brighter, and the air is thin and the solar energy gain higher.[The New York Times, 10/10/2025].
- The U. Sexpects to add on non-federal lands 32 more gigawatts of solar power in next 12 months.[CleanTechnica11/12/25].
- More wind turbines and solar panels were installed in China last year[2024]than the rest of the world combined.[The Daily, 11/18/25, Gilles Sabrie for The New York Times.]
And so it goes ….
The scientific career of Raymond N. Johnson, Ph.D., spanned 30 years in research and development as an organic/analytical chemist. He is currently founder and director of the Institute of Climate Studies USA (www.ICSUSA.org). Climate Science is published monthly.