
The Arctic Is Changing: The John Franklin Expedition
The year was 1845.
Many cartographers and some Arctic explorers in the early 1800’s believed there was away to sail from Europe and the North Atlantic Ocean to the Pacific Ocean and Orient by the “Northwest Passage” [NWP]. This ice-free corridor would shorten the time and many miles from aroute going around South America or Africa. The eastern portion near the Atlantic Ocean and the western portion near the Pacific Ocean of NWP were known. It was the middle part that was still unexplored and unkno wn.
Captain Sir John Frankln left England on May 19, 1845, with 129 men in two ships, HMS Erebus, and HMS Terror under his command. Their objective; find anorthwest passage to Asia. He, his men, and two ships were last seen by a whaler off the west coast of Greenland on July 28, 1845.
Map of the probable routes taken by HMS Erebus and HMS Terror during Franklin’slost expedition.
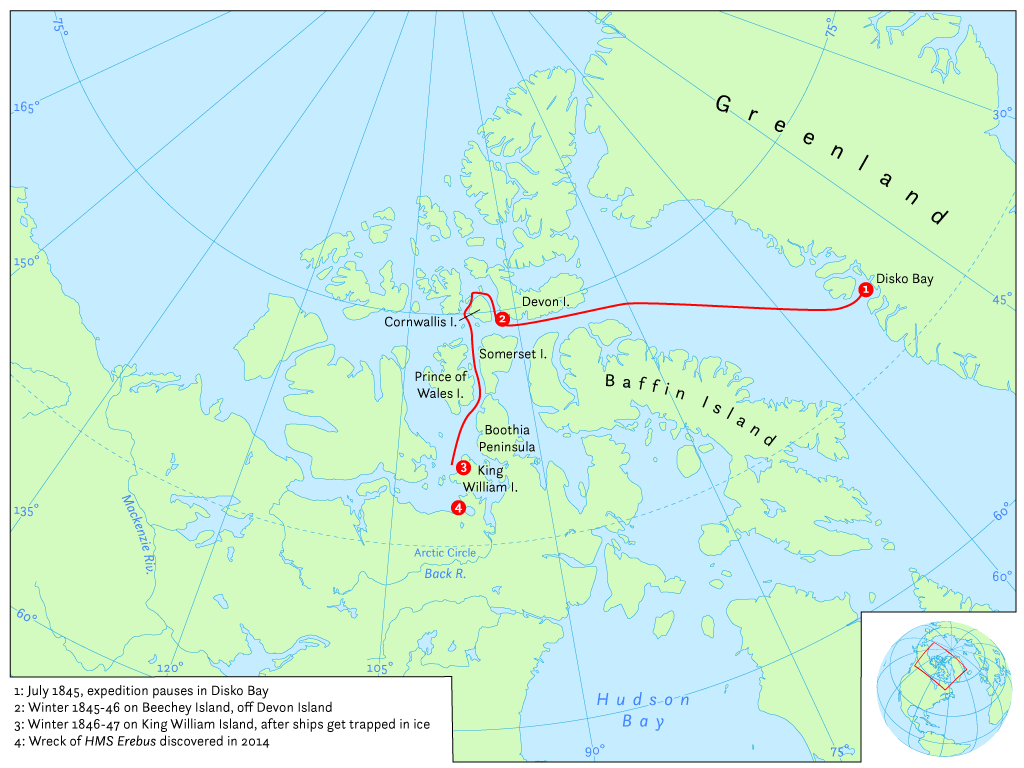
And then they vanished.
So, what happened?
Some 26 search land and sea expeditions over the next 30 years provided some clues. The ships were apparently stuck in the ice for extended periods of time, and food poisoning, starvation, and exposure to cold and disease [scurvy and tuberculosis] took their toll. They had all perished.
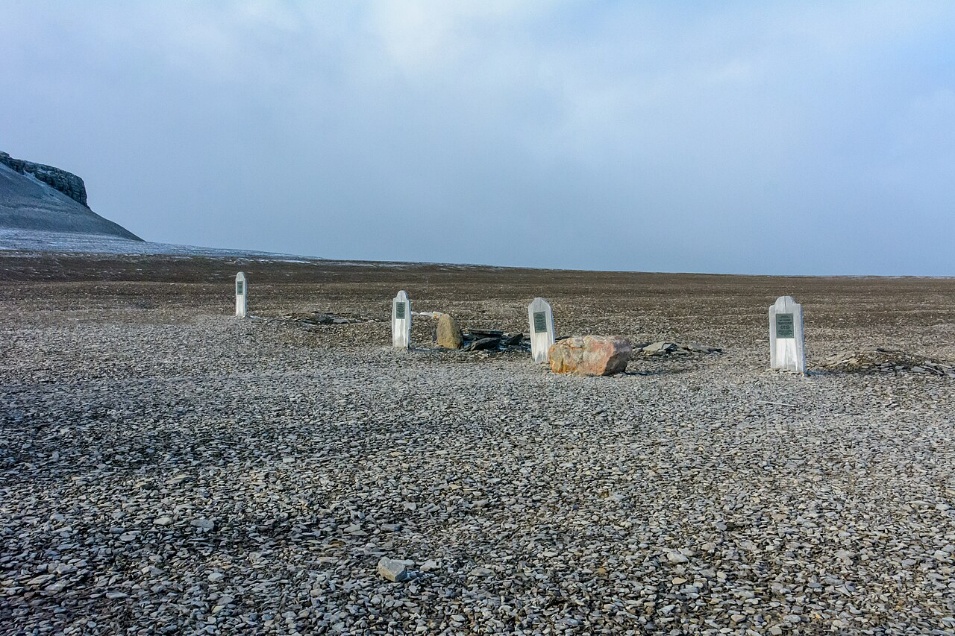
The four graves and headstones at the first camp by aharbor on Beechey Island, Nuna vut, Canada are ahaunting scene of the area where the men were marooned for up to two years; [Photo: Wikipedia].
But curiosity about what exactly happened and searching never stopped and research is continuing. About 170 years later the first wreck was found in 2014 and the second was found in 2016. These sites and others nearby are now Canadian National Heritage Sites where artifacts and remains were found and most remain.
At about the time of this voyage the Industrial Revolution was getting underway [the 1800’s]and we began to consume fossil fuels in quantity, which early on was mostly coal. This began to change the chemical composition of our atmosphere, a sthe increased amounts of the molecule, carbon dioxide[CO2], and its physical characteristics, became known.
As an interesting aside, experiments in the 1850’s, by the American scientist and women’s rights activist Eunice Foote, showed that CO2 traps heat and proved that it is agreenhouse gas [GHG]. “As awoman, Foote was not permitted to present her own paper at the 1856 Association for the Advancement of Science meeting: aman read it for her”[Wikipedia].
Lack of recognition and gender bias was responsible for her ground-breaking work to be mostly ignored for more than acentury.
What we know today is that global warming is heating up the Arctic faster, and more than twice as much, as the rest of the planet. See the graph with three lines titled, “Every world region has warmed – the Arctic and Europe much more than others.” [Data source: Contains modified Copernicus Climate Change Servi ce information (2025), Our World in Data.]
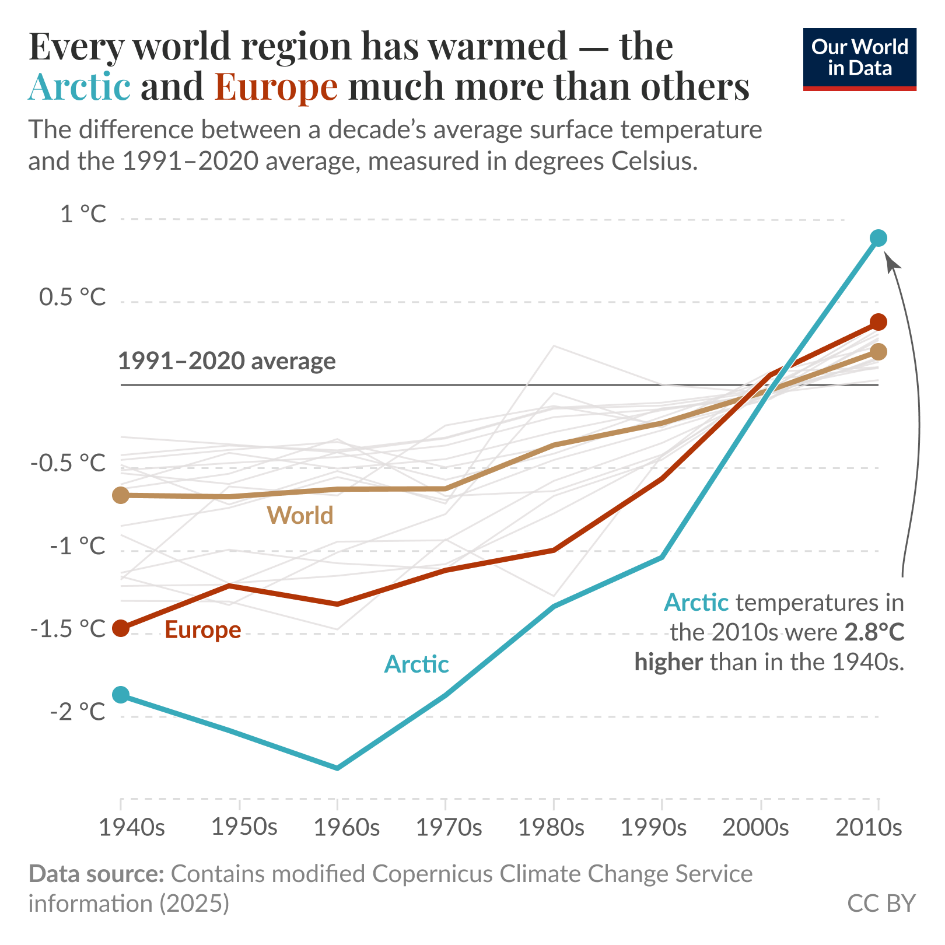
The average global temperature is the straight line going across and labeled “1991-2000 average” and is designated as “zero degrees C.” See left axis. Each decade’s average [bottom axis] is then measured relative to it with the 19 40’s, 19 50’s, etc. all cooler than the 1991 – 2000 average.
However, starting in the years 1980 and 1990, temperatures of the “World,” “Europe,” and the “Arctic” began to increase sharply. Note that the “Arctic” line shows more than twice the recent warming as the other areas. Note also that the Arctic has increased about 2. 8 degrees Cover the past 75 years or almost 5 degrees F.
This increase in Arctic temperatures has brought about profound changes in the region. Melting permafrost, loss of and thinning of sea ice, significant methane, and carbon dioxide emissions from buried and decaying organic matter, changing caribou migration patterns and more have all been impacted.
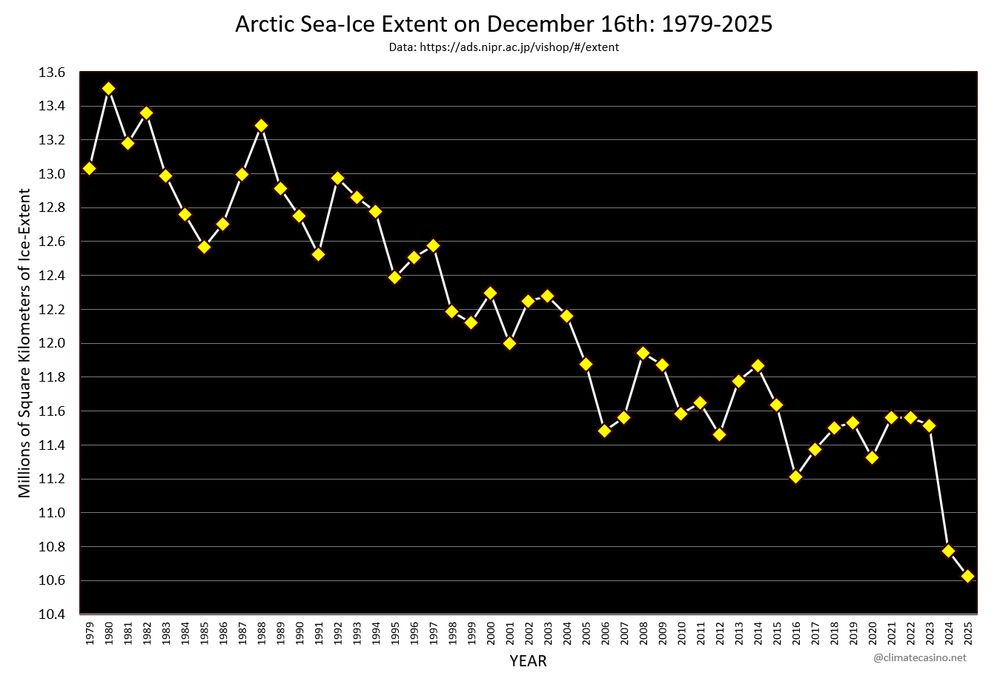
Note the graph, “Arctic Sea-Ice Extent on December 16 th: 1979-2025.” This 46-year record of Arctic sea-ice extent tells apowerful story. There are year-to-year variations but the overall downward trend showing 1,000,000 square kilometers less sea-ice is startling. [12/18/25 substack post; Bill McKibben from The Crucial Years].
Today, we now can cross the NWP by sea, something that the Franklin Expedition could only dream of. In addition to afew commercial voyages, in 2016 the cruise ship “Crystal Serenity” with 1700 passengers and crew took a 28-day cruise from Vancouver, B. C. , across the Canadian Arctic and NWP, and on to New York City.
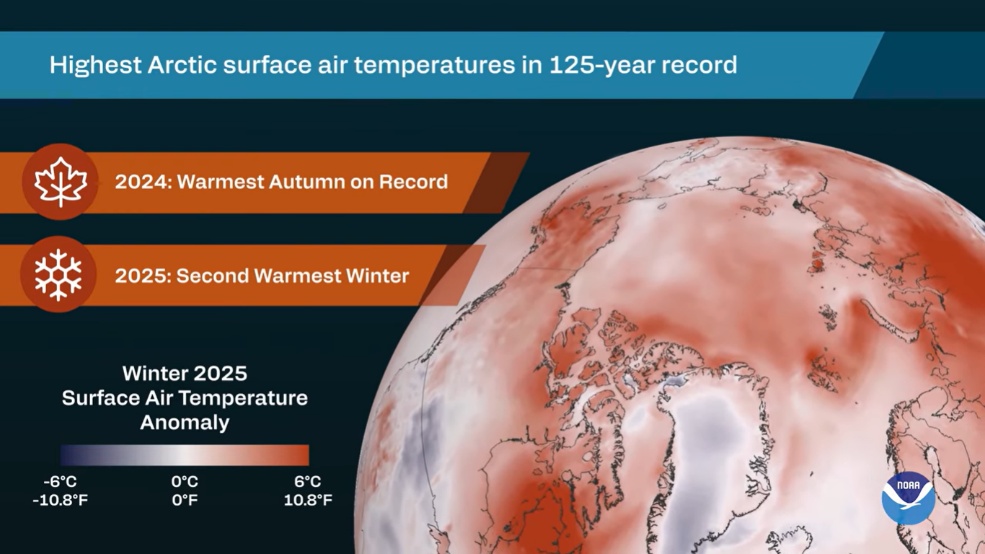
Additional data supplied from NOAA further illustrate the increased temperatures in the Arctic. See the illustration titled, “Highest Arctic surface air temperature in 125-year record.” This region in 2024 had the “Warmest Autumn on Record.” It also had the “Second Warmest Winter” in 2025 in that same 125 – year record. Note the darker colors in the polar regions on the global map illustrate the higher temperatures.
The Franklin Expedition was just unlucky and picked the wrong century to attempt this passage.
Meanwhile:
– China is producing enough clean energy to power the United States!
-In November 2025 electric vehicle auto registrations in the UK were 38.4 % of the total.
– China has the capacity to generate more solar energy than the rest of the world and have installed more than 40% of all the global wind energy.
– The U. S. government EPA website removed “fossil fuels” as cause of global warming.
-Over the past 10 years Americans have endured 190 separate billion-dollar weather-related disasters.
And so it goes.
The scientific career of Raymond N. Johnson, Ph.D., spanned 30 years in research and development as an organic/analytical chemist. He is currently founder and director of the Institute of Climate Studies USA (www.ICSUSA.org). Climate Science is published monthly.