
Extreme Weather, Climate Change, Global Warming: It is Here
The folks at the National Weather Service [NWS] in Alaska were nervous. They were kind of caught between a rock and a hard place. Their instruments, data, and computer forecast showed that a heat advisory was needed. However, they know that the current administration denies that climate change and warming is an issue. The staff also know that hundreds of NWS professionals have been fired along with the closing of many weather forecasting centers.
However, they rose to the occasion in what many consider the nation’s coldest state and informed the public about what was coming. For the first time ever parts of Alaska will be under a heat advisory. “ In the high glare of a summer evening in Fairbanks, Alaska, Ciara Santiago watched the mercury climb. A meteorologist at the National Weather Service office, she had the dubious honor of issuing the state’s first-ever official heat advisory as temperatures were expected to hit the mid-80s.” [Grist: June 16, 2025].
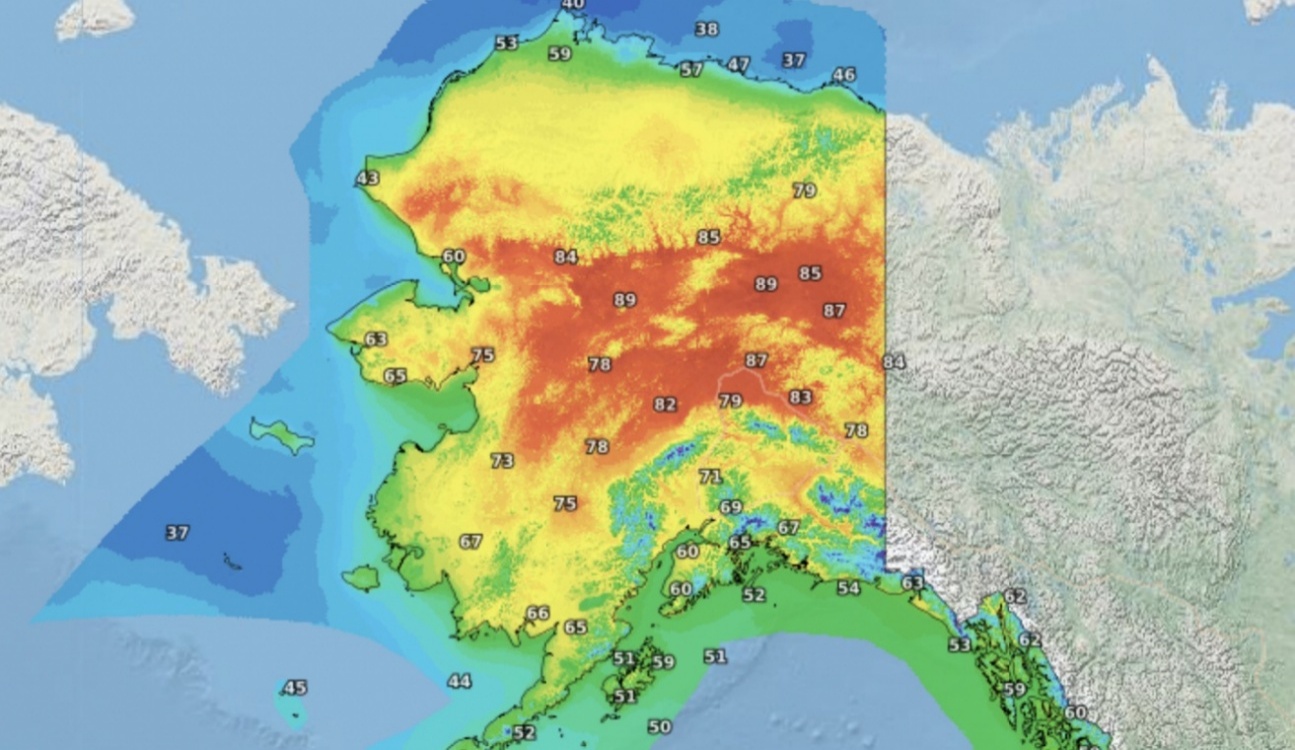
Fairbanks, on 6/22/25 could top 85 degrees, which is unusual for June although higher temperatures have been recorded later in the year. Readings well into the upper 50’s are expected along the Arctic coast. See map of the state supplied by NOAA [National Ocean and Atmospheric Administration.
The numbers are a bit hard to read but the dark areas in the center of the state show expected temperatures of 85 to 89 degrees F. In the lower 48 states these temperatures may be normal but not in Alaska.
Meteorologists have data that show the Arctic is warming at twice the rate compared with states and areas further south.
One reason for this is what is called “Arctic Amplification” [THIS, May 5, 2025]. One definition is that “heat from the sun bounces off the bright landscape, which then mixes with warm water vapor in the atmosphere. This heat is not being absorbed in the ground because of the ice so it has nowhere to go: … it becomes trapped in the atmosphere. As more ice melts, more warm water vapor is created, which then causes the ice to melt even further.” Repeat! Thus, the region is caught in an intense greenhouse effect.
About 175 years of Earth’s temperature data is summarized in the graph title d, ”Earth’s Average Temperature.” It was published by the group Berkeley Earth.
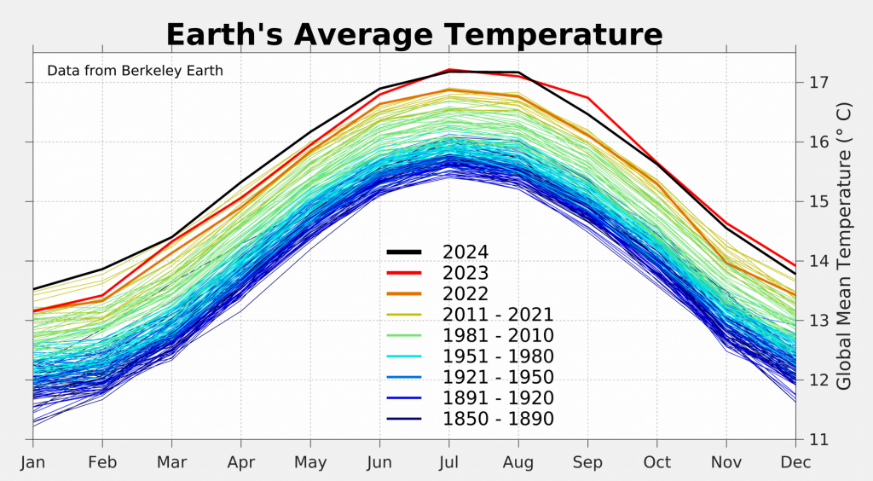
The bottom of the chart starts with January on the left and then moves to December on the right. The vertical axis gives Earth’s average temperature across the 12-month period. Each line represents the temperatures of a year and while they kind of smoosh together a definite pattern is evident. As we go from the bottom curves[1850 to the 1920’s]we can see a gradual increase in the average temperature across the full year.
And the increases do not stop. As we go into the 1980 ’ sand beyond, the average temperatures continue to increase and then we come to the most recent years, 2023 and 2024, which set global high temperature records. There is an enormous amount of data here and the warming of the planet is clearly evident.
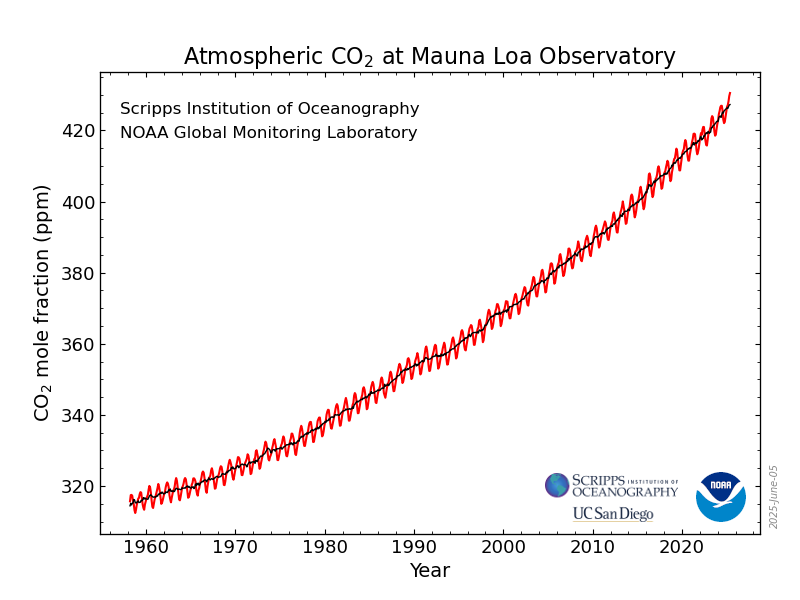
This warming is almost entirely due to the ever-increasing amounts of greenhouse gases [GHG] in the atmosphere of which carbon dioxide is the major component. See the graph with the zig-zag line in the graph titled, “ Atmospheric CO2 at Mauna Loa Observatory. ”
This graph shows the ever-increasing amounts of this GHG, primarily due to the combustion of fossil fuels.
AND, this may be one of the last times we will see this graph.
Although it is the oldest, continuous observation station on the planet, the administration is planning to stop funding it.
We are now at ~430 parts per million, the highest level in several million years.
And we know that the increased temperature and energy in the atmosphere changes our weather patterns and is a primary cause of extreme weather events, i. e. , droughts, flash floods, heat waves, extreme amounts of rainfall and more.
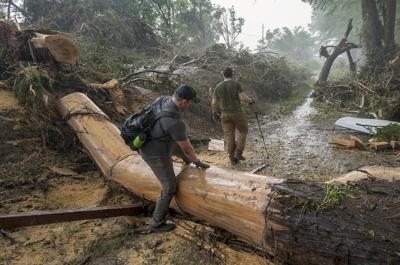
A tragic extreme weather event occurred on July 4 and 5, 2025. Up to 15 inches of rain fell in some areas of Kerr County, TX which led the Guadalupe River to rise at an alarming rate. In less than a 4-hour period, in the middle of the night, the river rose from 7 feet to 29 feet. One report stated that the river rose to the height of a 2-story building in less than an hour. It was described as a “pitch-black wall of death.” Well over 110 people have died with many more missing. While finger pointing blame to local to state to federal agencies goes on, the real reason for this tragic event is climate change.
The power of this volume of water, the devastation, the enormous amount of debris, is hard to fathom. One powerful photo, by Rodolfo Gonzalez – FR171494 AP, shows volunteers searching for missing people along a portion of the sixty miles of the riverbanks. Other on-line photos and videos give one a sense of the magnitude of this disaster.
Meanwhile, China races ahead in the renewable energy area with research, development, and deployment of wind, solar and battery technology. A major article in the New York Times 7/5/2025, contrasts China’s lead and direction in renewable energy while the US is returning to the use of fossil fuels.
Not good.
And, so it goes.
The scientific career of Raymond N. Johnson, Ph.D., spanned 30 years in research and development as an organic/analytical chemist. He is currently founder and director of the Institute of Climate Studies USA (www.ICSUSA.org). Climate Science is published monthly.